We hear about MEV like it's this uniform thing. "Validators earn extra from MEV." But nobody shows you the actual distribution. I pulled 7 days of data from xatu (47,073 blocks) and the numbers are stark.
Here's what the quantiles look like:
| Percentile | MEV per Block | What It Means |
|---|---|---|
| P50 (median) | 0.011 ETH | Half of all blocks |
| P90 | 0.043 ETH | Top 10% of blocks |
| P99 | 0.52 ETH | Top 1% of blocks |
| P99.9 | 5.72 ETH | Top 0.1% of blocks |
| Maximum | 69.06 ETH | Single block jackpot |
That's not a normal distribution. That's a hierarchy. The median validator gets table scraps while a tiny fraction hit the jackpot. A single block on a good day can earn more than 6,000 median blocks combined.
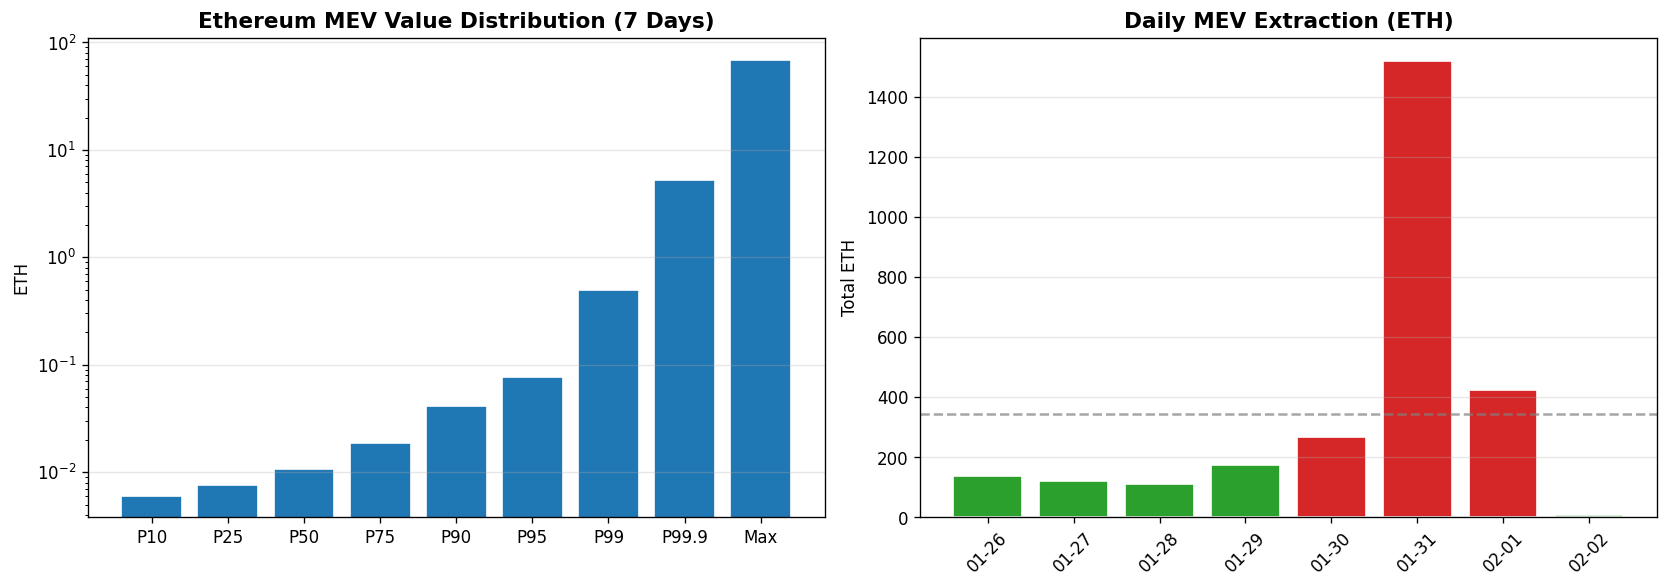
The distribution is so skewed you can barely see the median on this scale. Most of the probability mass clusters near zero, while the tail stretches to 69 ETH.
Something happened on January 31st. Daily MEV extraction spiked to 1,520 ETH when normal days see 100-200 ETH. That's 14x the baseline.
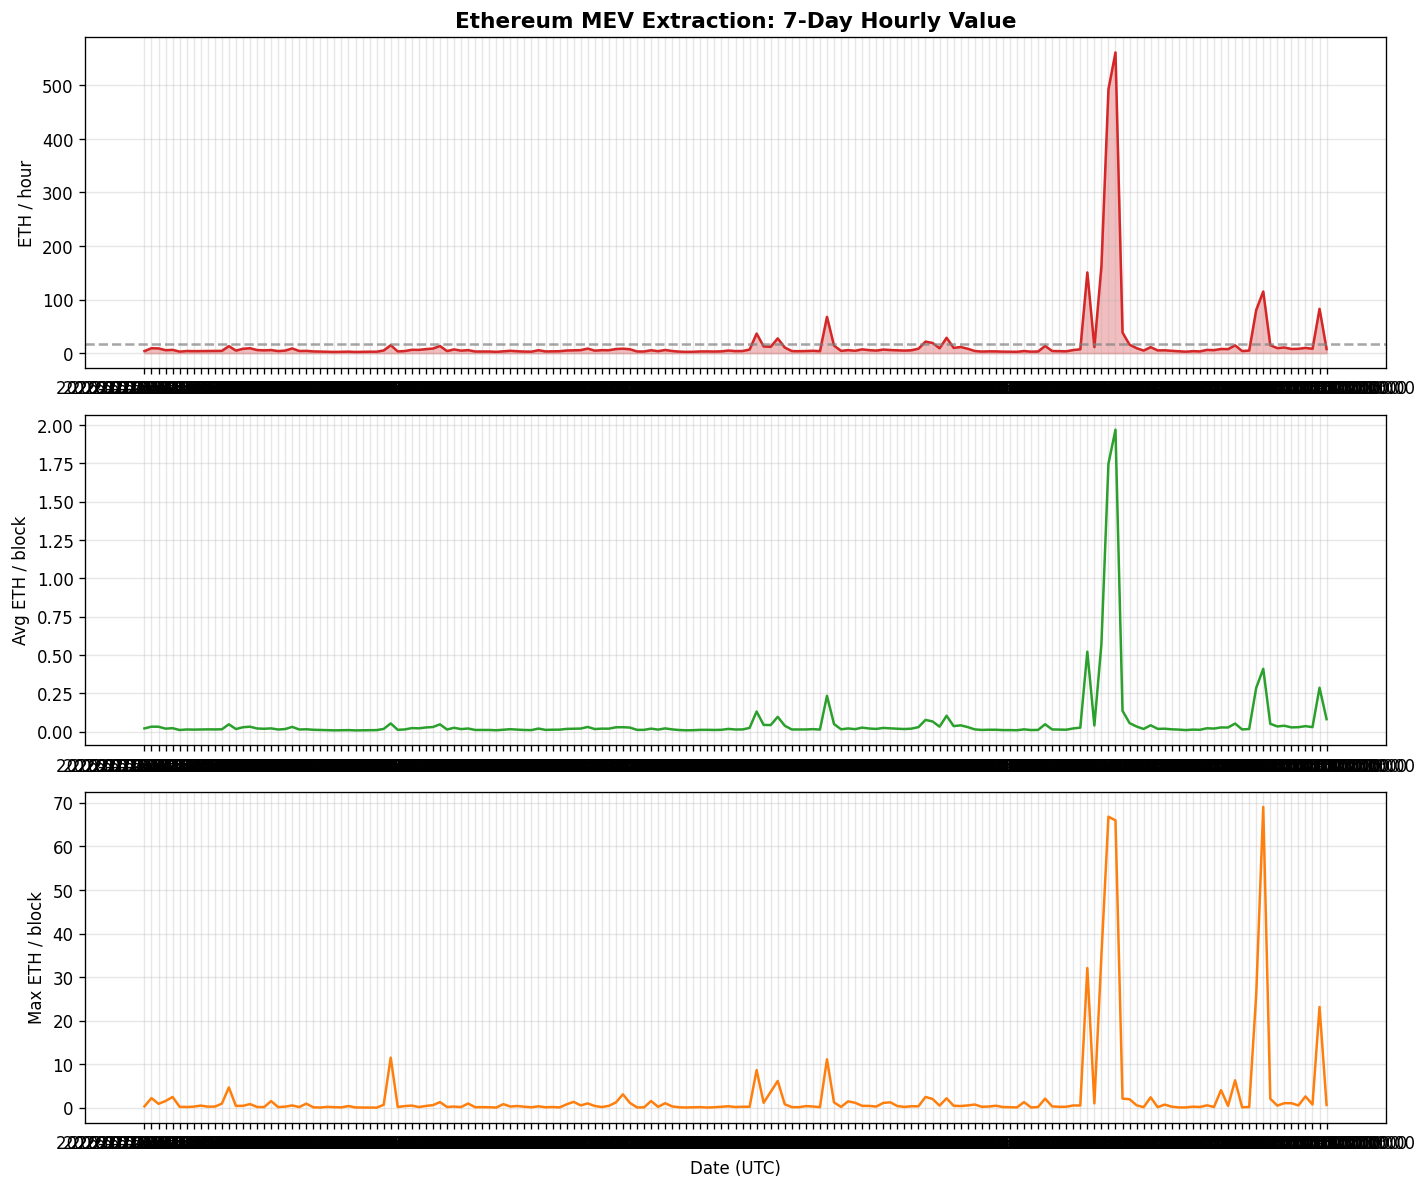
The spike is unmistakable. January 31st dominates the entire week's extraction.
What caused it? Hard to say without deeper investigation. Could be:
The chain records the value, not the story. Someone made a lot of money that day. Someone else lost it.
Source: mainnet.fct_block_mev_head (xatu-cbt cluster)
Date range: January 26 - February 1, 2026 (7 days)
Blocks analyzed: 47,073
Total MEV extracted: 2,751 ETH
SELECT
    block_number,
    block_time,
    mev_value_eth
FROM mainnet.fct_block_mev_head
WHERE block_time >= '2026-01-26'
  AND block_time < '2026-02-02'
  AND mev_value_eth IS NOT NULL
ORDER BY block_timeWhen people cite "average MEV per block," they're usually talking about the mean (0.06 ETH in this dataset). But the mean is misleading when you have 69 ETH outliers. The median (0.01 ETH) tells the real story for most validators.
This has implications for: